Civil Services Examination · Question 63
Directions for the following 2 (two) items : Consider the following graph in which the birthrate and death rate of a country are given, and answer the two items that follow.
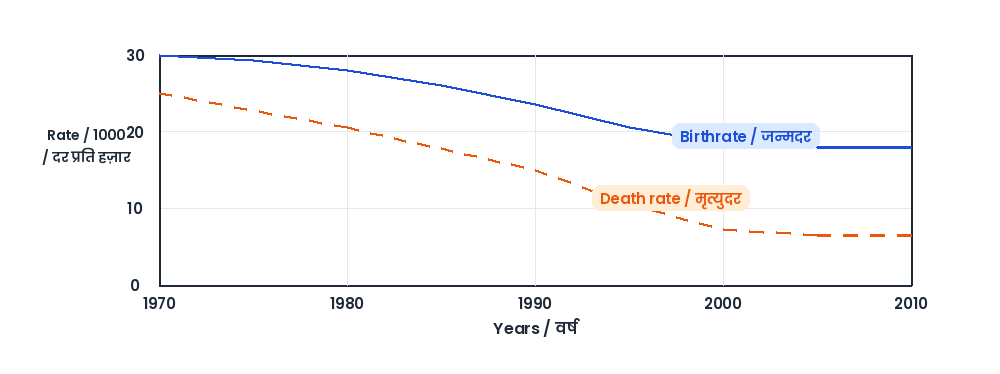
Looking at the graph, it can be inferred that from 1990 to 2010
Show answer & explanationShow explanation
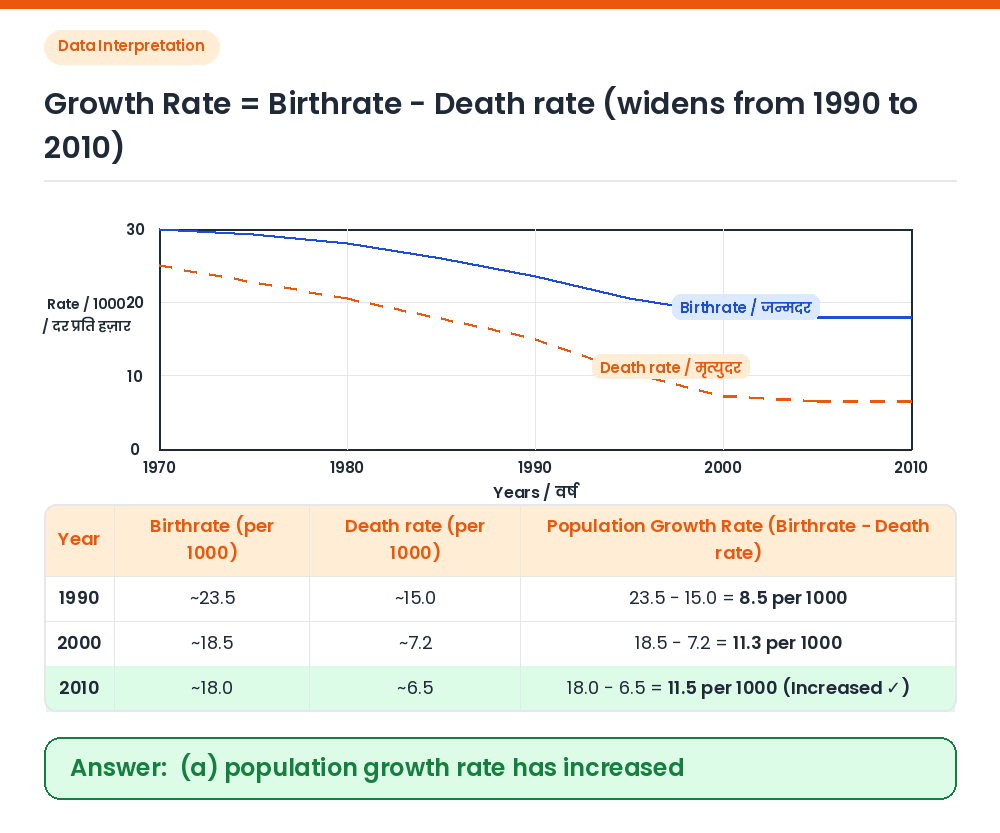
Answer: (A) population growth rate has increased
Given: Graph showing Birthrate (solid line) and Death rate (dashed line) per thousand from 1970 to 2010. Formula for natural population growth rate: Population growth rate = Birthrate − Death rate (the vertical gap between the two curves). Compare vertical gap in 1990 vs 2010: In 1990, Birthrate ≈ 23.5 and Death rate ≈ 15.0 ⇒ Growth rate ≈ 8.5 per thousand. In 2010, Birthrate ≈ 18.0 and Death rate ≈ 6.5 ⇒ Growth rate ≈ 11.5 per thousand. Conclusion: Because Death rate fell much faster than Birthrate between 1990 and 2000 and both levelled off after 2005, the gap (population growth rate) increased from 1990 to 2010. Correct Answer: (a) population growth rate has increased