Civil Services Examination · Question 71
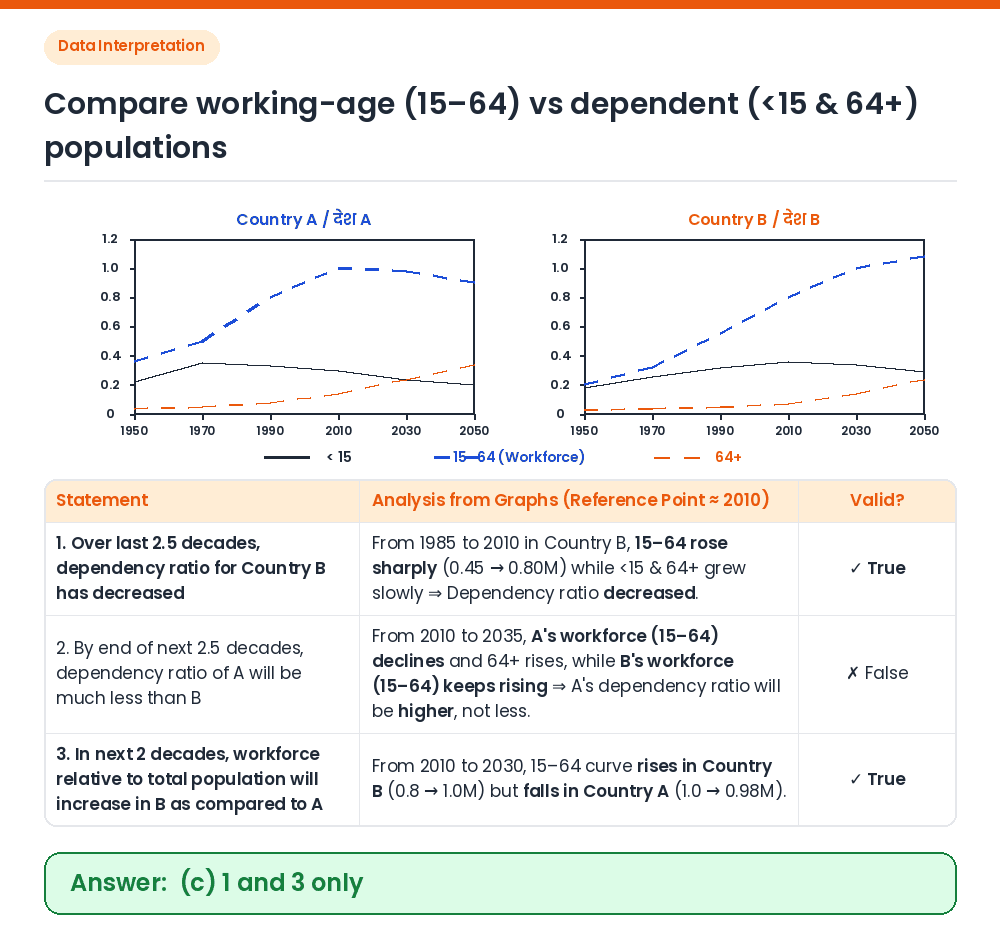
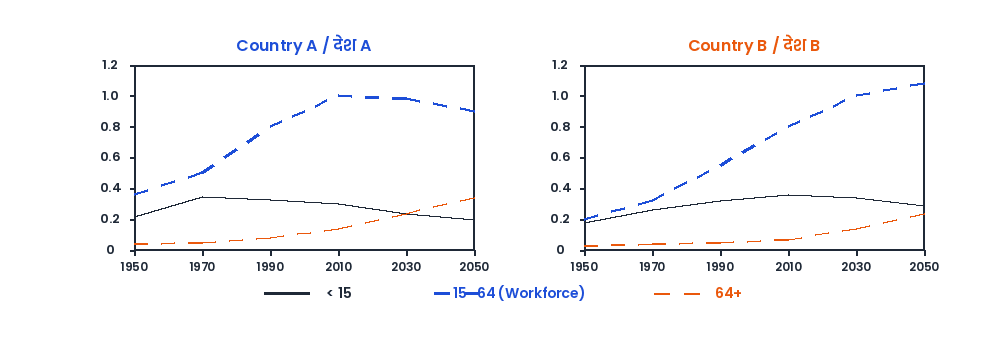
Consider the following graphs. The curves in the graphs indicate different age groups in the populations of two countries A and B over a period of few decades : With reference to the above graphs, which of the following are the most logical and rational inferences that can be made? 1. Over the last two and a half decades, the dependency ratio for country B has decreased. 2. By the end of next two and a half decades, the dependency ratio of country A will be much less than that of country B. 3. In the next two decades, the work-force relative to its total population will increase in country B as compared to country A. Select the correct answer using the code given below.
Show answer & explanationShow explanation
Answer: (C) 1 and 3 only
Given: Population graphs for Country A and Country B across age groups <15, 15–64 (working age), and 64+ from 1950 to 2050 (with current reference around 2010). Define Dependency Ratio: Dependency ratio = [Population (<15) + Population (64+)] ÷ Working-age Population (15–64). Check Statement 1: Over the last 2.5 decades (1985–2010) in Country B, the working-age population (15–64) grew rapidly while dependents (<15 and 64+) grew much slower ⇒ Dependency ratio decreased (1 is true). Check Statements 2 and 3: Over the next 2 to 2.5 decades (2010–2035), Country B's workforce (15–64) continues to rise strongly (0.8M → 1.0M+) while Country A's workforce peaks in 2010 and declines as its 64+ population rises. Thus, Statement 3 is true and Statement 2 is false. Correct Answer: (c) 1 and 3 only