Civil Services Examination · Question 58
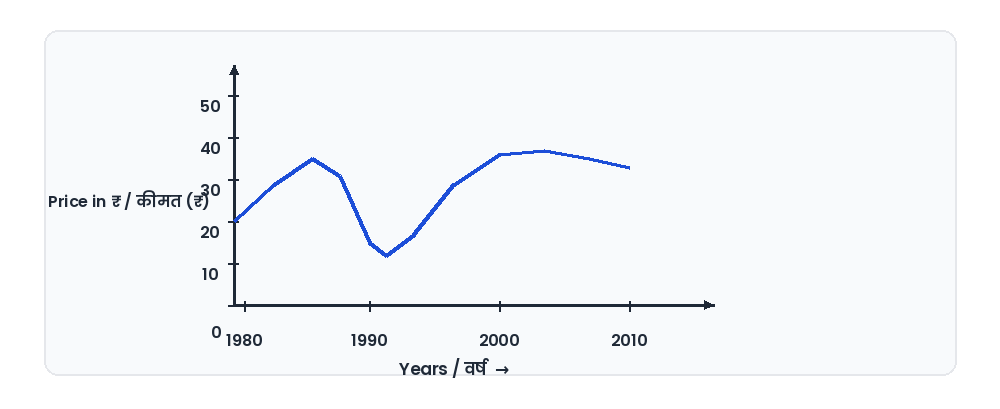
Year-wise variation of the price of a certain commodity is shown in the following graph: The price of the commodity in the year 1990
Show answer & explanationShow explanation
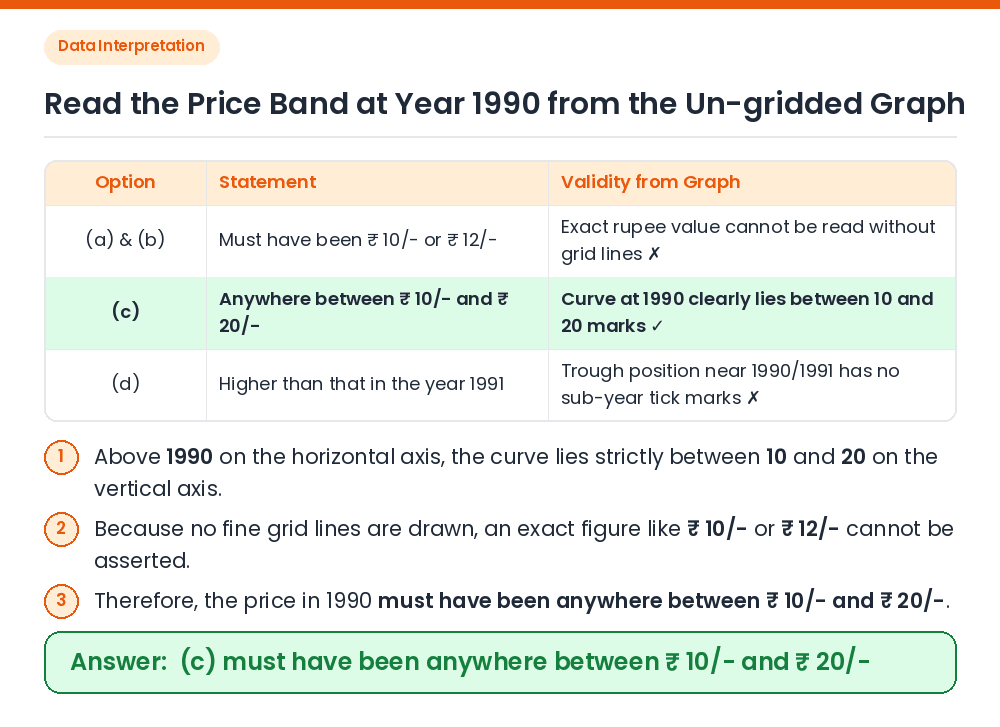
Answer: (C) must have been anywhere between ₹ 10/- and ₹ 20/-
Given / Concept: A line graph showing the price of a commodity (in ₹) against years (1980, 1990, 2000, 2010) with vertical axis marks at 0, 10, 20, 30, 40, and 50. Locate Year 1990 on X-axis: Looking vertically above 1990, the curve is near its lower trough, clearly above the 10 mark and below the 20 mark on the Y-axis. Check Precision of Graph: Since the graph has no grid lines or sub-divisions between 10 and 20 (or between 1990 and 2000), exact values such as ₹ 10/- or ₹ 12/- cannot be determined. Result: The price of the commodity in 1990 must have been anywhere between ₹ 10/- and ₹ 20/-. Correct Answer: (c) must have been anywhere between ₹ 10/- and ₹ 20/-