Civil Services Examination · Question 59
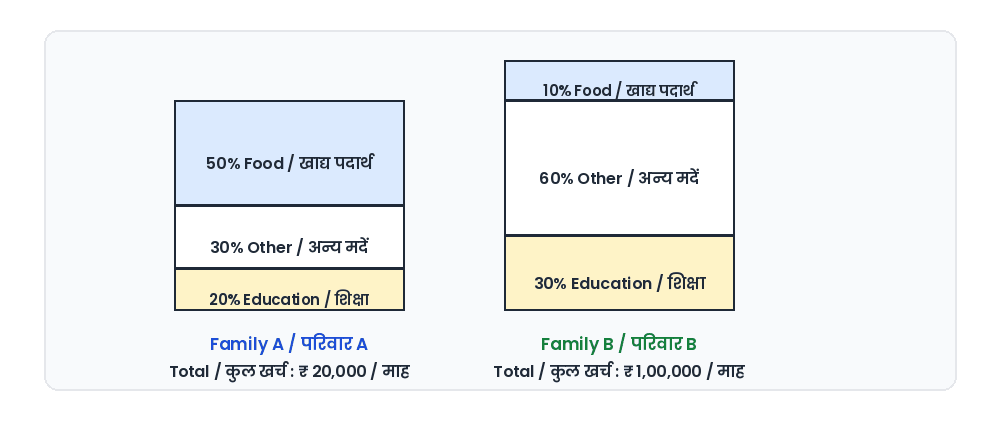
The proportion of expenditure on various items by two families A and B are represented in the following Bar Charts: From these charts, we can conclude that
Show answer & explanationShow explanation
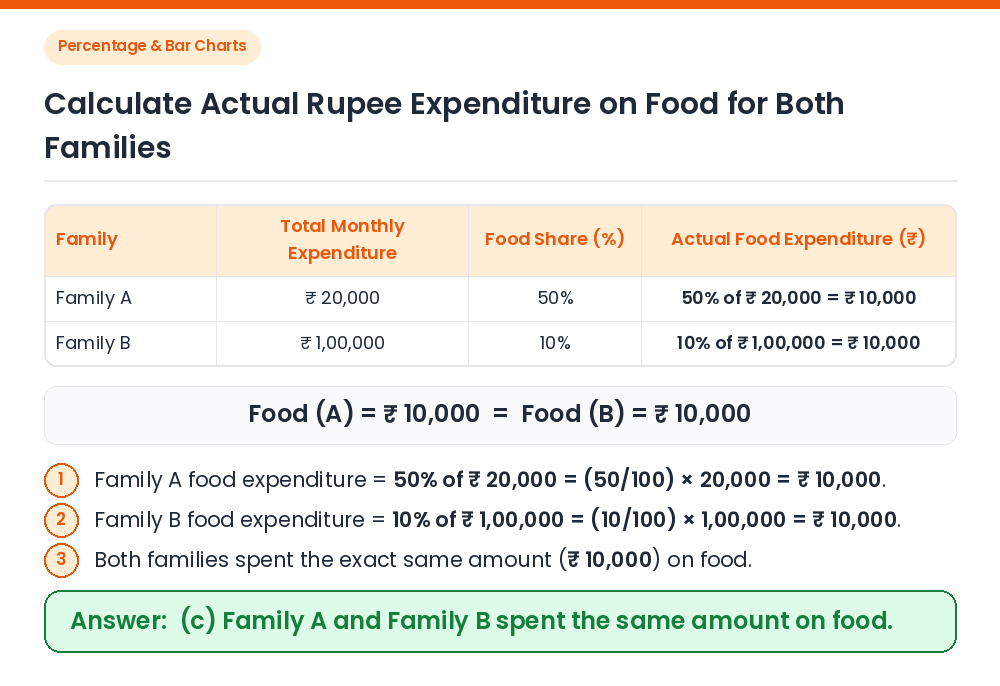
Answer: (C) Family A and Family B spent the same amount on food.
Given / Concept: Family A spends 50% of ₹ 20,000 on food, and Family B spends 10% of ₹ 1,00,000 on food. Food Expenditure of Family A: 50% of ₹ 20,000 ⇒ (50/100) × 20,000 = ₹ 10,000. Food Expenditure of Family B: 10% of ₹ 1,00,000 ⇒ (10/100) × 1,00,000 = ₹ 10,000. Result: Since ₹ 10,000 = ₹ 10,000, both families spent the exact same amount on food. Correct Answer: (c) Family A and Family B spent the same amount on food.