Civil Services Examination · Question 11
Directions for the following 3 (three) items : The following three items are based on the graph given below which shows imports of three different types of steel over a period of six months of a year. Study the graph and answer the three items that follow. The figures in the brackets indicate the average cost per ton over six months period.
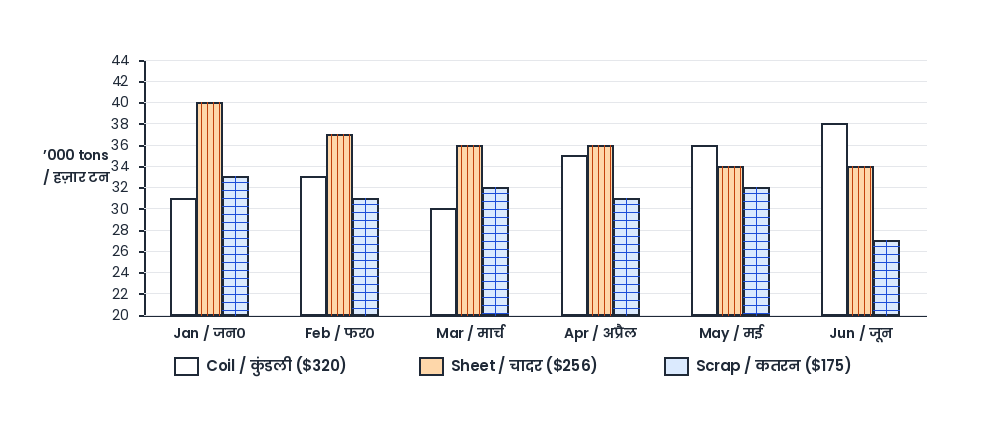
By how much (measured in thousands of tons) did the import of sheet steel exceed the import of coil steel in the first three months of the year?
Show answer & explanationShow explanation
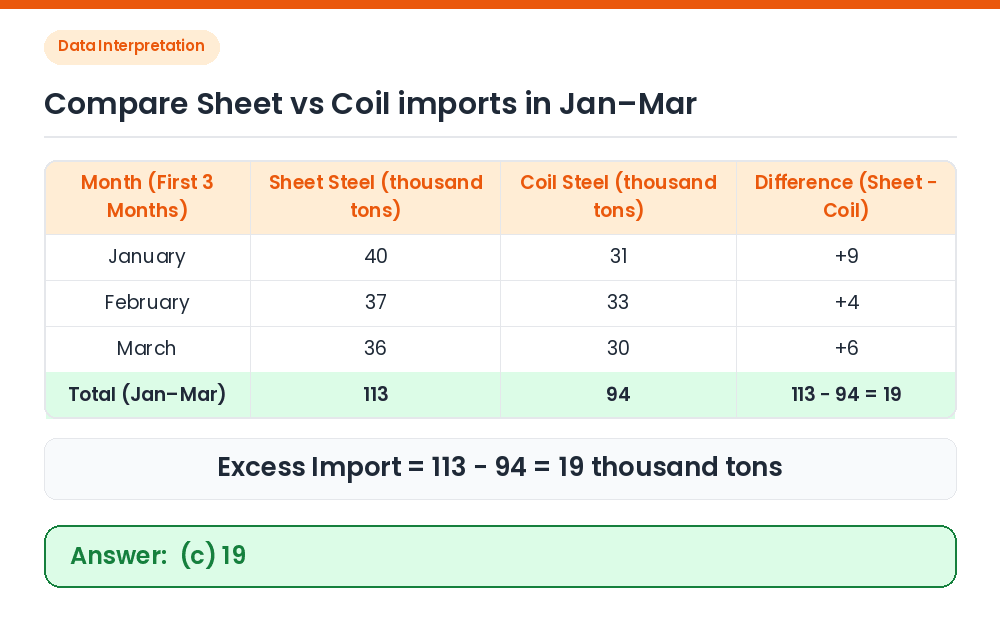
Answer: (C) 19
Given: Bar graph showing monthly imports (in thousands of tons) of Coil, Sheet, and Scrap steel from January to June. Sheet steel in first 3 months: January = 40, February = 37, March = 36 ⇒ Total Sheet = 40 + 37 + 36 = 113 thousand tons. Coil steel in first 3 months: January = 31, February = 33, March = 30 ⇒ Total Coil = 31 + 33 + 30 = 94 thousand tons. Calculate difference: Excess of Sheet over Coil = 113 − 94 = 19 thousand tons. Shortcut: Sum month-by-month differences directly: (40 − 31) + (37 − 33) + (36 − 30) = 9 + 4 + 6 = 19. Correct Answer: (c) 19