Civil Services Examination · Question 76
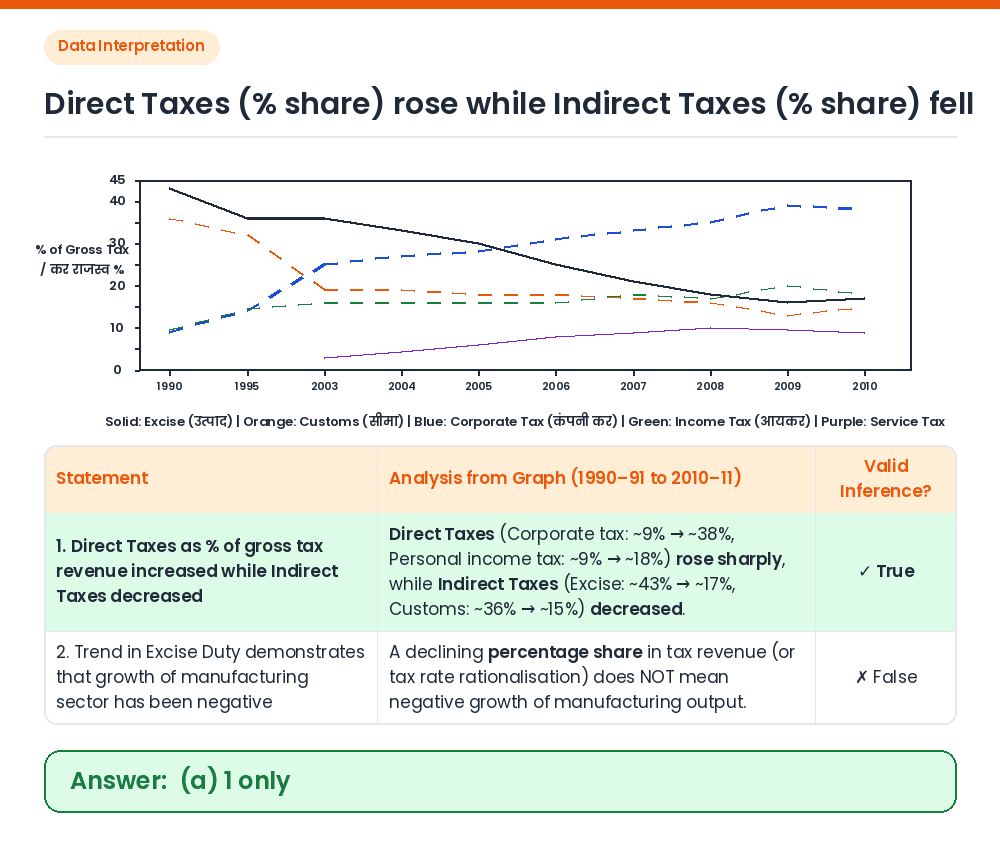
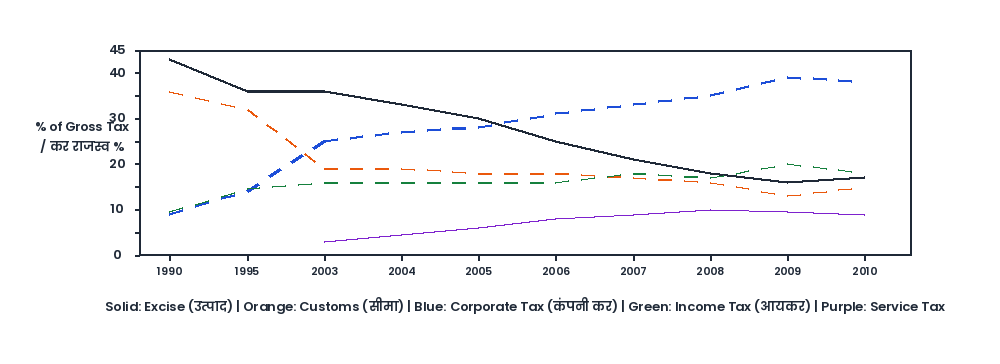
The following graph indicates the composition of our tax revenue for a period of two decades : With reference to the above graph, which of the following is/are the most logical and rational inference/inferences that can be made? 1. During the given period, the revenue from Direct Taxes as percentage of gross tax revenue has increased while that of Indirect Taxes decreased. 2. The trend in the revenue from Excise Duty demonstrates that the growth of manufacturing sector has been negative during the given period. Select the correct answer using the code given below.
Show answer & explanationShow explanation
Answer: (A) 1 only
Given: A line graph showing the percentage share of Excise, Customs, Corporate tax, Personal income tax, and Service tax in Gross Tax Revenue from 1990–91 to 2010–11. Check Statement 1: Direct taxes (Corporate tax + Personal income tax) increased from about 19% (9.5% + 9.5%) in 1990–91 to about 56% (38% + 18%) in 2010–11. Meanwhile, Indirect taxes (Excise + Customs, even with Service tax) decreased from ~79% to ~41%. Thus Statement 1 is true. Check Statement 2: The graph only shows Excise Duty as a percentage of gross tax revenue, not absolute manufacturing output or tax rates. A lower percentage share of Excise Duty does not imply negative growth in manufacturing (Statement 2 is false). Correct Answer: (a) 1 only